
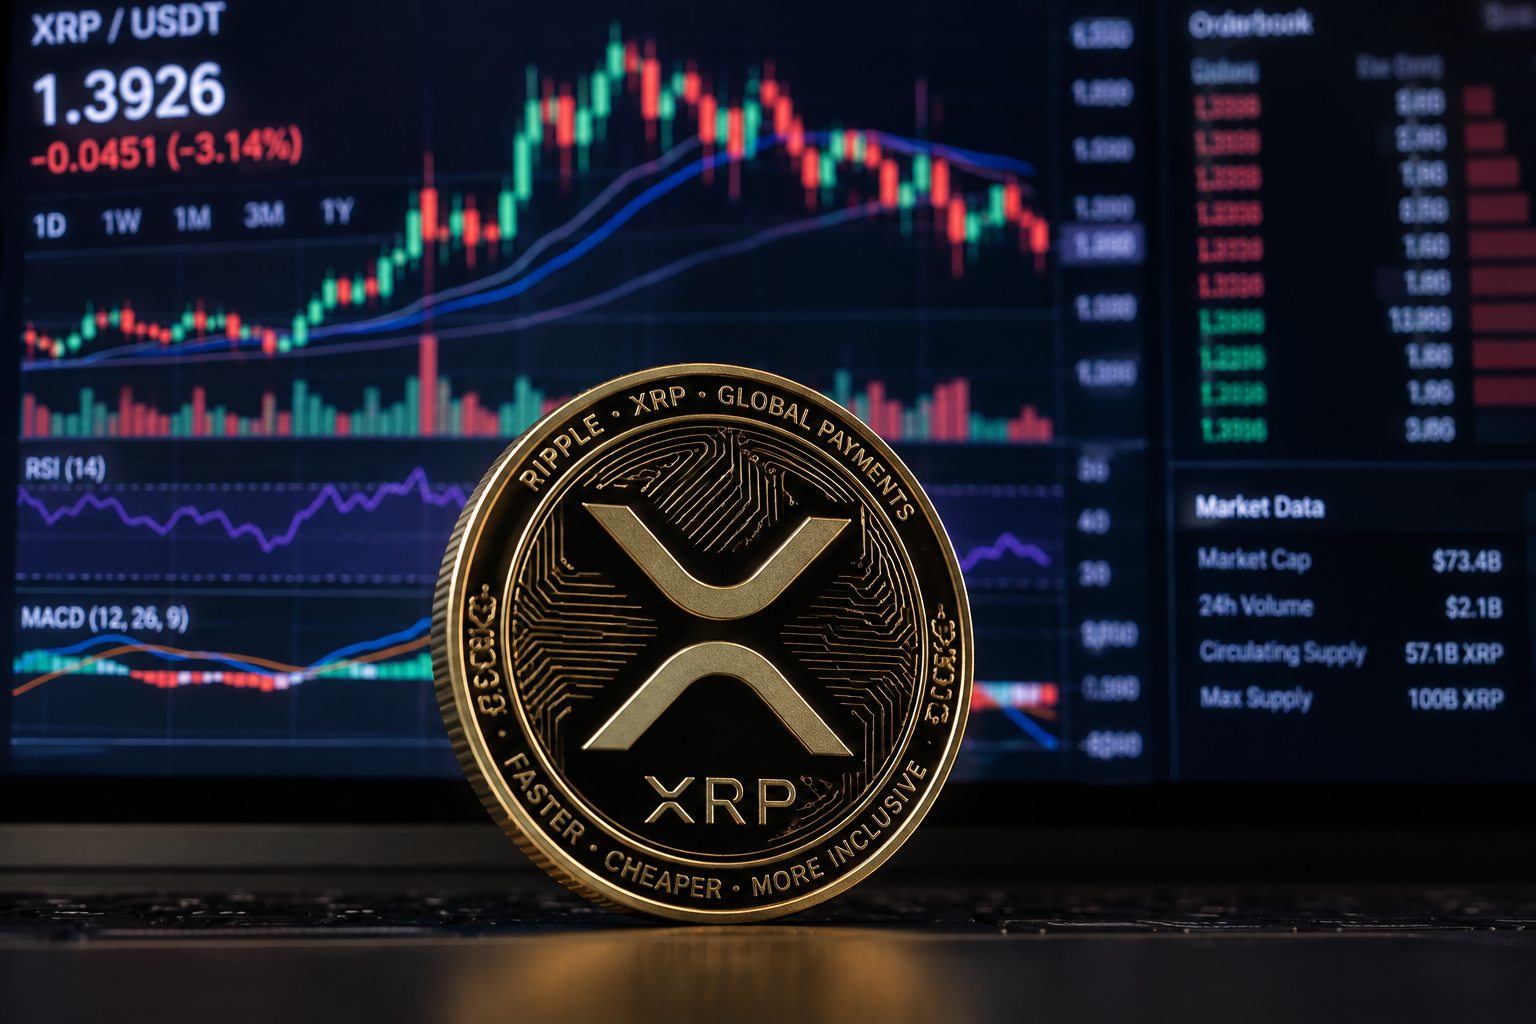
XRP traded around $1.25 on Tuesday as a subdued recovery failed to dispel technical warnings following the cryptocurrency’s roughly 16% October decline.
The token was down about 0.76% over 24 hours, having rebounded from a recent slide towards $1.20.
Yet XRP remains below its major daily exponential moving averages, while its relative strength index, or RSI, sits near 37, signalling weak buying momentum.
Immediate support lies around $1.23 to $1.24. A sustained break below $1.20 could put the next major downside area near $1.10 in focus, leaving traders watching whether consolidation gives way to renewed selling.
Bearish moving-average crossover tests XRP’s recovery
XRP’s 20-day exponential moving average stands near $1.31, while the 50-day is around $1.34. Its 100-day EMA is approximately $1.33 and the 200-day near $1.37, placing all four above the current price.
These averages smooth out daily fluctuations to show the underlying trend.
Trading below them suggests sellers retain an advantage, while the 50-day EMA slipping beneath the 200-day marks a bearish crossover, often called a death cross.
That is an EMA signal, not necessarily the same pattern on simple moving averages.
XRP’s daily RSI near 37 is below the neutral 50 mark, but remains above 30, the conventional threshold for oversold conditions. The MACD momentum indicator is also negative.
Crypto analyst EGRAG Crypto observed on November 1 that October’s 16% slide ranked among XRP’s four worst October performances since 2013. Seven of the 13 completed Novembers through 2025 also ended lower, according to his review.
Why a break below $1.23 could trigger forced selling
XRP’s nearest test lies at $1.23 to $1.24, a support area that has helped contain recent losses. If sellers push through it, traders may revisit $1.20, where buyers emerged after the late-October retreat.
A sustained daily close below $1.20 would weaken that defence and expose the lower boundary of a descending price channel near $1.10. From $1.25, that would represent about 12% further downside, not a guaranteed destination.
Leveraged positioning could make any breakdown more volatile.
CryptoinsightUK warned that open interest had risen 6.7% even as XRP’s price edged 0.15% lower.
Positive funding rates suggested traders were paying to maintain bullish positions. If the price drops sharply, exchanges can automatically close leveraged bets that no longer have sufficient collateral, adding selling pressure to an already weak market.
Can XRP buyers reclaim $1.30 before another decline?
For XRP bulls, $1.27 is the first level to recover. Beyond that, the $1.30 to $1.31 area combines descending-channel resistance with the 20-day EMA, making it a more meaningful test of a rebound.
Sustained strength above that barrier could bring $1.34 and then $1.36 to $1.37 into view. Repeated failures would instead reinforce the bearish trend.
Analyst Ali Martinez noted on November 2 that XRP’s four-hour Bollinger Bands had narrowed to their tightest since August.
He viewed a four-hour close above $1.27 as bullish and one below $1.23 as bearish. The compression signals potential volatility, not its direction.
There is some support from investment flows, as US spot XRP exchange-traded funds reportedly attracted $18.83 million in October despite the token’s decline.
The post XRP price faces a deepening technical warning after October's 16% crash appeared first on Invezz